Mandelbrot Shading Algorithms
This section describes the algorithms used to colour in the patterns.
There are six colouring algorithms (Standard, Stars, Bands, Real Bands, Imaginary Bands and Quadrants). "Quadrants" isn't available in the WebGL version.
The rest of this page discusses these schemes in the contex of the Python script (on the WebGL page they are selected through the use of the buttons on the page).
In Python the colouring scheme is selected using the second character of the 't' command, for instance −tBS will use the stars colouring scheme on a pattern drawn in the B plane. "Standard" is the default, the others are selected by appending one of the letters ('S', 'B', 'R', 'I' or 'Q') onto the −tM parameter.
The Algorithms
'Classic' Algorithm
This colours the pattern by counting the number of iterations we have to perform before |Z| becomes greater then 2.
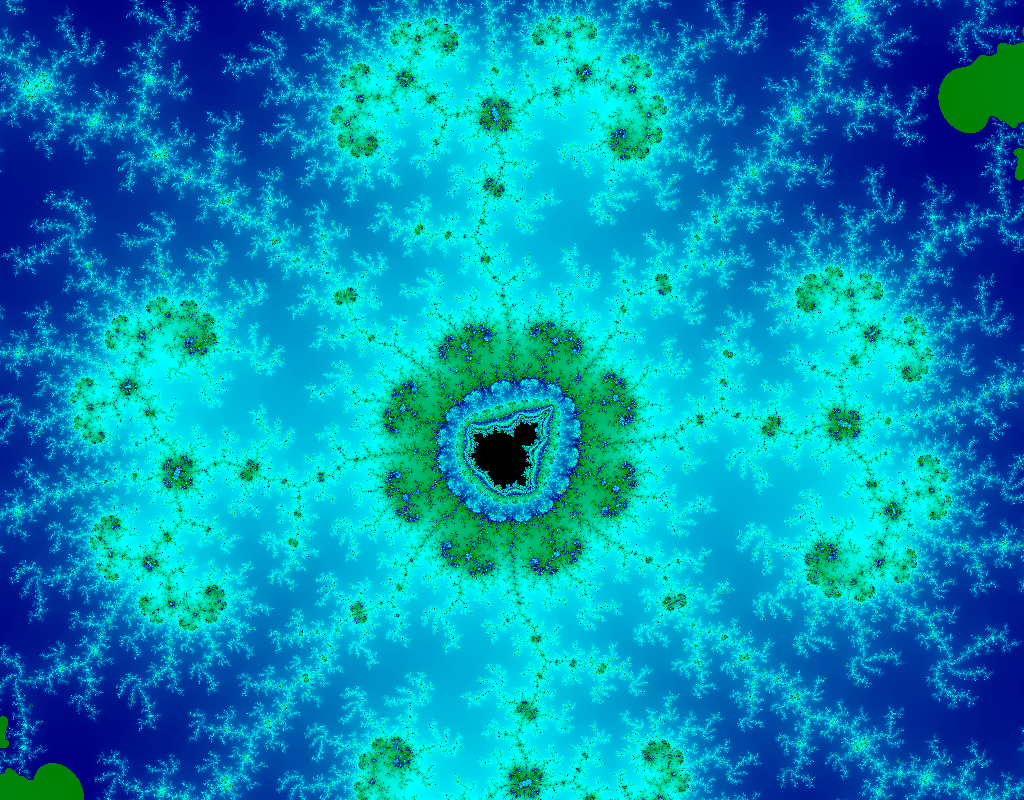 |
A classic mandelbrot image |
'Stars' Colouring Algorithm
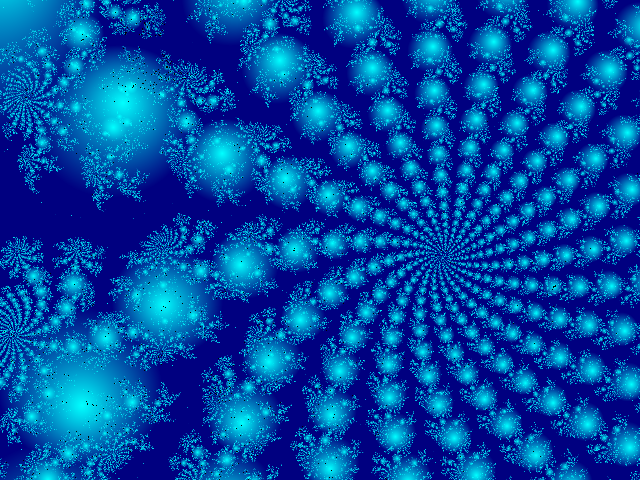
The stars colouring algorithm iterates the same equation as the standard scheme, but it also records the values of |Z| during the iteration. The smallest |Z| value encountered is used to decide the colour. This generates a pattern where the mini-mandelbrots, which are found throughout the set, appear to be surrounded by glowing halos as can be seen in the next image.
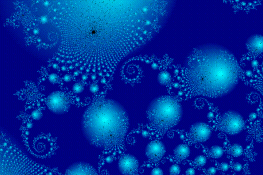
Here are a couple of frames taken from an animation. They are separated by a zoom factor of 26 (64) and have 'blob' factors of 0.001 and 0.0001.
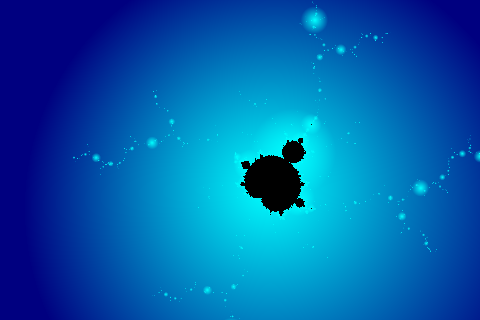
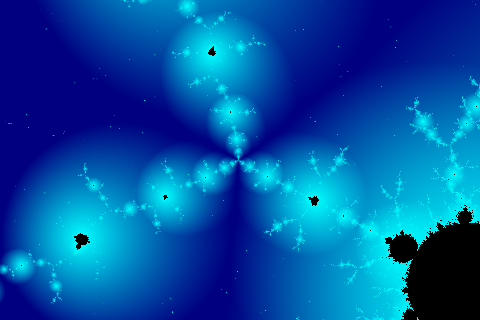
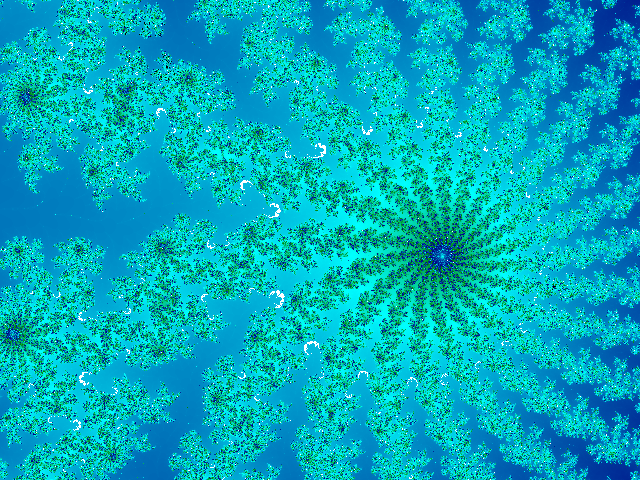
There is a stars animation on the animations page. In some circumstances the stars algorithm is much better at highlighting the structure as can be see in these next two images. (The commands to generate them are displayed alongside.)
|
StandardMandelbrotDriver.go ("‑tM ‑i32000 ‑c(0,0.26480,−1.747586,0.00345198) ‑s640x480 ‑fw21xxx ‑m120000 ‑l16") |
|
Starspython mandelbrotdriver.py ‑tMS ‑i3200 ‑c(0,0.26480,−1.747586,0.00345198) ‑s640x480 ‑fw21s ‑m120000 ‑b0.00005 |
'Bands' Colouring Algorithm
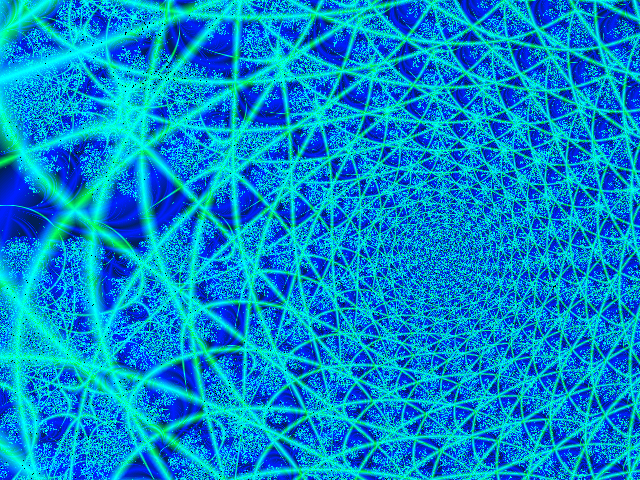
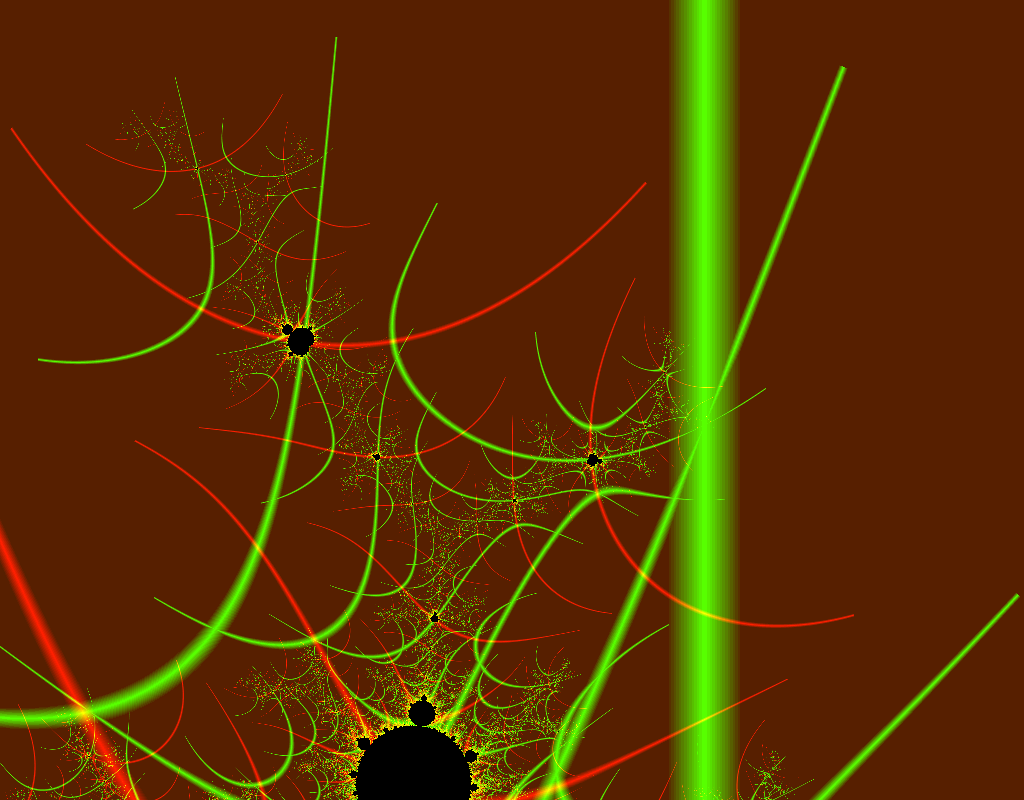
In the bands colouring algorithm, instead of calculating the smallest value of |Z| encountered during the iteration we monitor the real and imaginary parts independently, finding the smallest values of |r| and |i|. We then calculate a colour based on the combination of the two. Palettes 4 and 5 arrange the colours to emphasise the bands. The next image corresponds to the ones in the stars section, the remaining two further illustrate the bands algorithm.
|
python mandelbrotdriver.py ‑tMB ‑i3200 ‑c(0,0.26480,−1.747586,0.00345198) ‑s640x480 ‑fw21b ‑m120000 ‑b0.00005 |
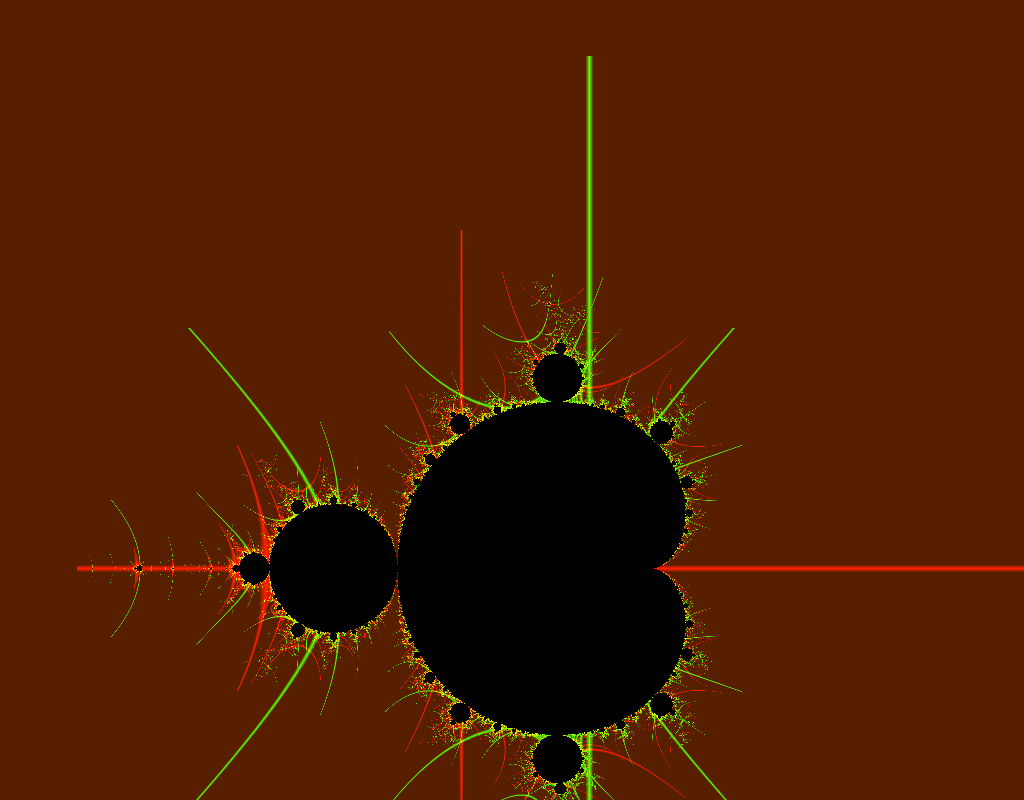 |
python mandelbrotdriver.py ‑tMB ‑s1024x800 ‑fb2 |
|
python mandelbrotdriver.py ‑tMB ‑c(0,0,−0.075,1.01) ‑m10 ‑s1024x800 ‑fb1 |
Imaginary and Real Bands
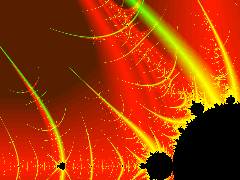
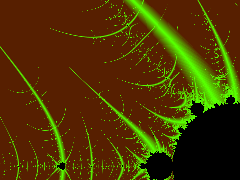
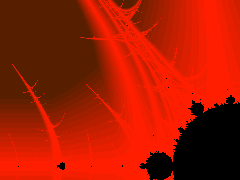
The colouring scheme used to generate the bands pattern can be split into two separate components, showing the contribution from the real and the imaginary elements. "‑tMI" will draw the imaginary part and "‑tMR" the real part ("‑tJI" and "‑tJR" for the Julia sets). This separation can be seen in the following three images, reproduced from the colour schemes table above.
| Bands (‑tMB) | Real Bands (‑tMR) | Imaginary (‑tMI) |
 |
 |
 |
Quadrants Colouring Scheme Bands
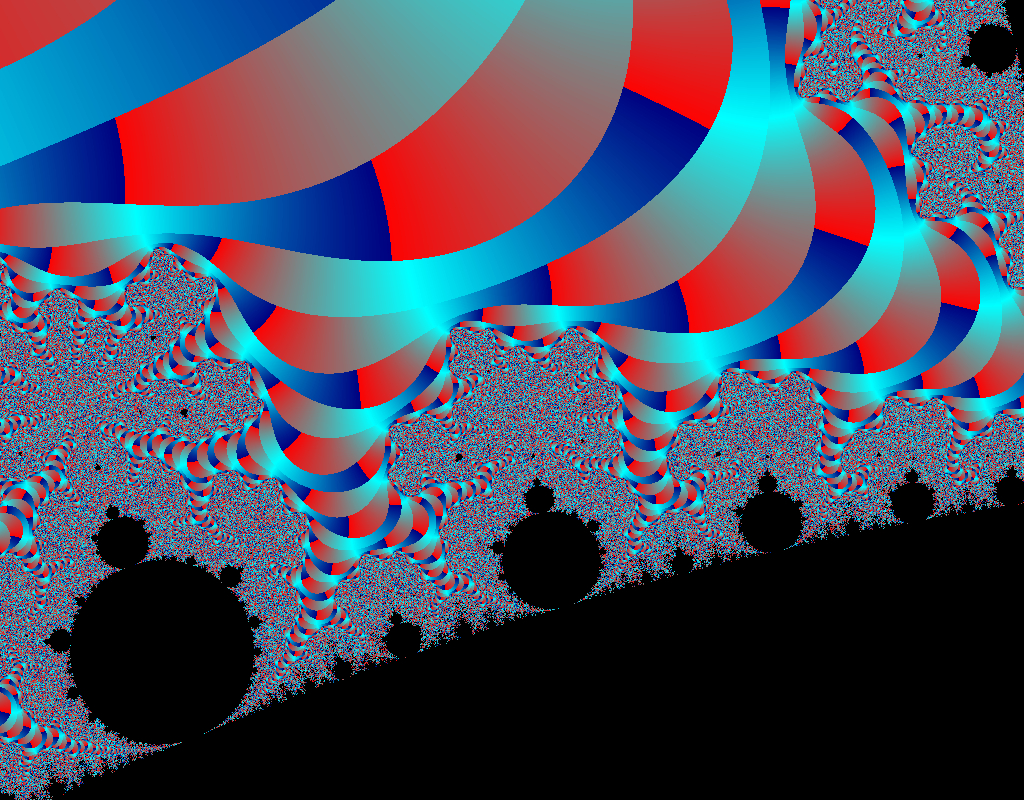 Click to enlarge.
|
I call this Quadrants as when I first thought of it I only had 4 colours, one for each quadrant ot the complex plane. But since then I have expanded it to include 255 colours. In this scheme you keep iterating z until you reach a point (x+iy) that has a modulus greater than 2 (x2 + y2 > 4). You then calculate the arc tangent of y ∕ x and use that as an index into the colour map. The result is an image like the one on the left. |